

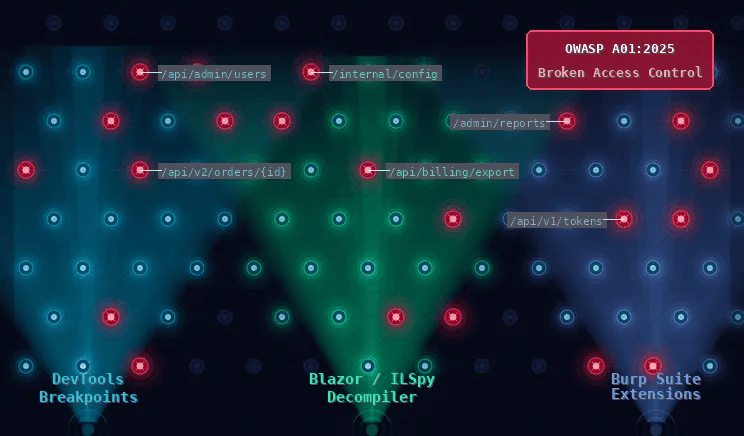
Broken Access Control sits at the top of the OWASP Web App Security Top 10 for a reason. It is one of the most common and most damaging flaws in modern web apps, and it is also one of the easier classes of vulnerability to find once you know where to look. The catch is that you cannot test what you cannot see, so the very first step in any Broken Access Control assessment is enumeration.
It is uncommon for API pentesters to receive a correct and well-defined OpenAPI or Swagger spec sheet. Yet a clean, comprehensive list of API endpoints is essential before you start swapping IDs and watching what comes back.
This post walks through three enumeration techniques I rely on during real engagements. None of them are exotic, but together they will pull endpoints out of places a basic proxy crawl will miss.
Why Endpoint Enumeration Comes Before Access Controls Testing
Broken Access Controls testing is conceptually simple. You take an authenticated request that references an object you own, change the identifier to one you should not own, and observe whether the server hands you data back. The hard part is not the test itself but knowing every place that test can be run.
Modern apps surface dozens or hundreds of endpoints, many of which never appear in normal user flows. Admin paths, legacy versions, internal tooling, mobile-only routes, and feature-flagged previews all live behind the same API host. Miss them in enumeration and you miss them in testing. The goal of this phase is coverage, not exploitation.
Method 1: Pulling JavaScript From Behind Auth Walls With DevTools Breakpoints
This one is my favorite because it solves a problem most testers run into early. You hit an application, the page loads for half a second, and then it redirects you straight to a third-party login wall. Frustrating, but here is the thing. If it was not an immediate HTTP Status Code 302 redirect, you may have downloaded the necessary JavaScript to uncover dozens of otherwise hidden endpoints. The JavaScript that defines the entire frontend, including every API path it knows how to call, is sitting in memory. You just need to freeze the page before the redirect fires.
Setting the Debugger Breakpoint
Open Firefox or Chrome DevTools before navigating to the target. Switch to the Sources panel and find the Event Listener Breakpoints section in the right sidebar. Expand Load, then check beforeunload or load. You can also try DOM Mutation Breakpoints or set a breakpoint on Script First Statement under the global listeners.
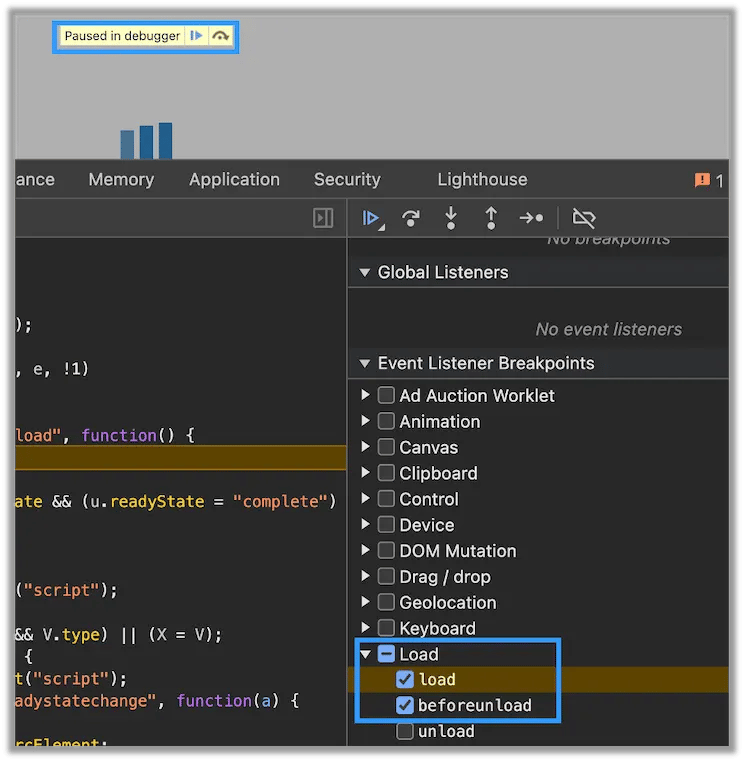
Now load the target URL. The page will pause as soon as it tries to navigate away. The Sources tree on the left will show you every loaded script, including bundled chunks, lazy-loaded modules, and source maps if the developer left them in production (which happens more often than you would think).
Saving and Analyzing the Bundle
Right-click any file in the Sources tree and choose Save as to dump it locally. For larger applications, save the whole folder structure. Once you have the files, you have options.
If the bundle is small and you want quick wins, run grep against it with patterns like `/api/`, `fetch(`, `axios.`, or `\.get\(['"\`]`. Most modern frameworks leave fingerprints that make endpoint extraction trivial once you know the syntax.
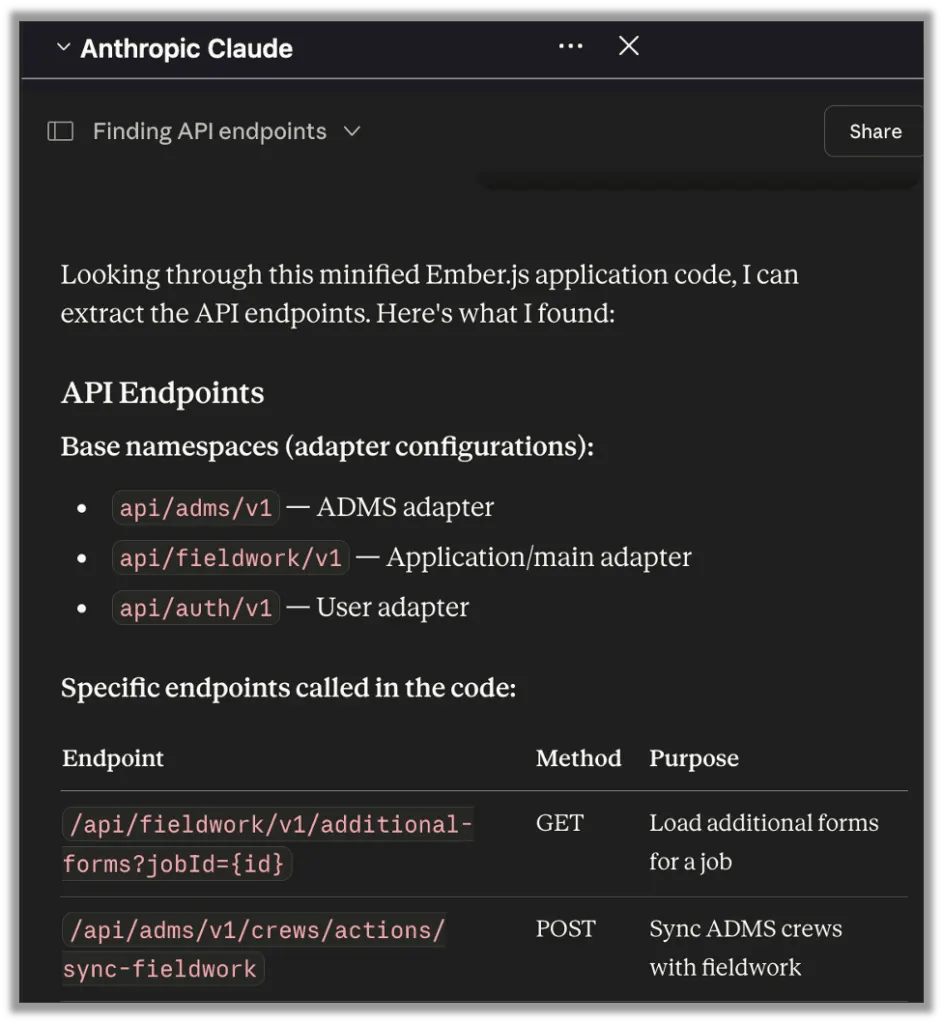
For larger or heavily minified bundles, this is where AI tooling earns its keep. Feed the JavaScript into a local model like a Llama or Qwen variant or into a frontier model if your client has approved it. Important caveat here: Only use a frontier model if your engagement contract permits it and you are using an enterprise account that contractually excludes your prompts from training data. Customer source code going into a free-tier consumer chat is a data leak waiting to happen.
The prompt I use is something like: “Extract every API endpoint from this JavaScript bundle. List the HTTP method, path, and any parameters you can identify. Flag any endpoints that look administrative or privileged.” Adjust to taste.
Method 2: Reverse Engineering Blazor WebAssembly Apps
Blazor WebAssembly is increasingly common in enterprise environments, and it presents a different enumeration challenge. Instead of JavaScript, you are looking at compiled .NET assemblies shipped to the browser as DLLs. Standard JS-focused tooling will skip right past them.
Finding the Assemblies
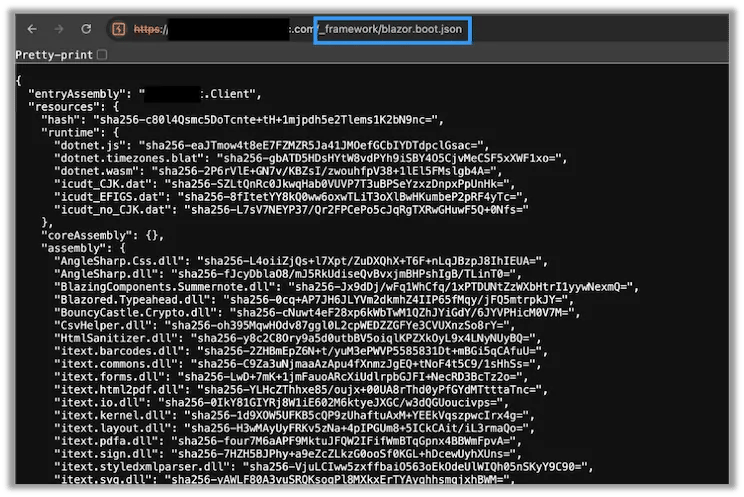
Start by pulling the app manifest. For a Blazor WASM app, this lives at a predictable path, typically `_framework/blazor.boot.json`. This file lists every assembly the app loads, along with hashes. Grab it and you have a complete inventory of the application’s compiled code.
From there, download each DLL referenced in the manifest. A short bash loop with curl will pull them all in a few seconds. Drop them into a working directory.
Decompiling With ILSpy
ILSpy is the go-to open source decompiler for .NET assemblies. Install it (the cross-platform CLI version, ilspycmd, works great in scripts) and run it against each DLL. Output as C# files into a single directory.
for dll in *.dll; do
    ilspycmd "$dll" -o ./decompiled/
done
Now you have human-readable C# source for the entire frontend. This is where grep does some of its best work. I would recommend limiting your grep to only the client’s custom code instead of all the third-party libraries. Search for common HTTP client patterns:
grep -rn "HttpClient" ./decompiled/
grep -rn "GetFromJsonAsync\|PostAsJsonAsync\|PutAsJsonAsync\|DeleteAsync" ./decompiled/
grep -rn "\[Route" ./decompiled/
grep -rn "/api/" ./decompiled/
You will surface controller routes, service classes that wrap API calls, and often hardcoded paths that never show up in normal browser traffic. Pay particular attention to anything in classes named something like `AdminService` or `InternalApiClient`. Those are the endpoints most likely to have weak object-level authorization because the developers assumed nobody outside the admin UI would ever find them. Additionally, it is a rich resource for Server-side Request Forgery targets and a simple grep for `localhost` or the internal IP address will help you generate a rich target list.
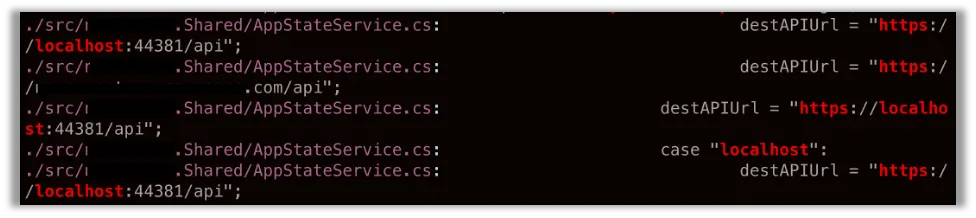
While you are here with the decompiled code, don’t forget to check for API keys and tokens. It isn’t uncommon for people to have hard coded secrets in these files.
The same data hygiene rules apply if you push decompiled code to an LLM. Get permission, use enterprise tooling, and never paste a client’s compiled application logic into a public chat interface.
Method 3: Burp Suite Extensions That Do the Logging For You
The first two methods are great for static analysis, but you also want something running in the background that captures every endpoint your browser actually hits during testing. Burp Suite extensions are perfect for this. There are several worth knowing about, and most pentesters end up running two or three at once.
GAP (Get All Parameters, Links, and Words)
GAP by xnl-h4ck3r is one of the most useful endpoint discovery extensions I have used. Available in the BApp Store or directly from GitHub, it parses both JavaScript files and inline JS in responses, extracting potential endpoints and parameters. You can point it at your entire sitemap or a specific target, and it will spit out a deduplicated list of links along with a custom wordlist for fuzzing.
JS Miner
JS Miner takes a similar approach but adds passive scanning that runs continuously as you browse. It picks up API endpoints across GET, POST, PUT, DELETE, and PATCH methods, hunts for hardcoded secrets using Shannon entropy, and can reconstruct source code from JavaScript source maps if any are exposed. Run it alongside GAP for broader coverage.
JS Analyzer
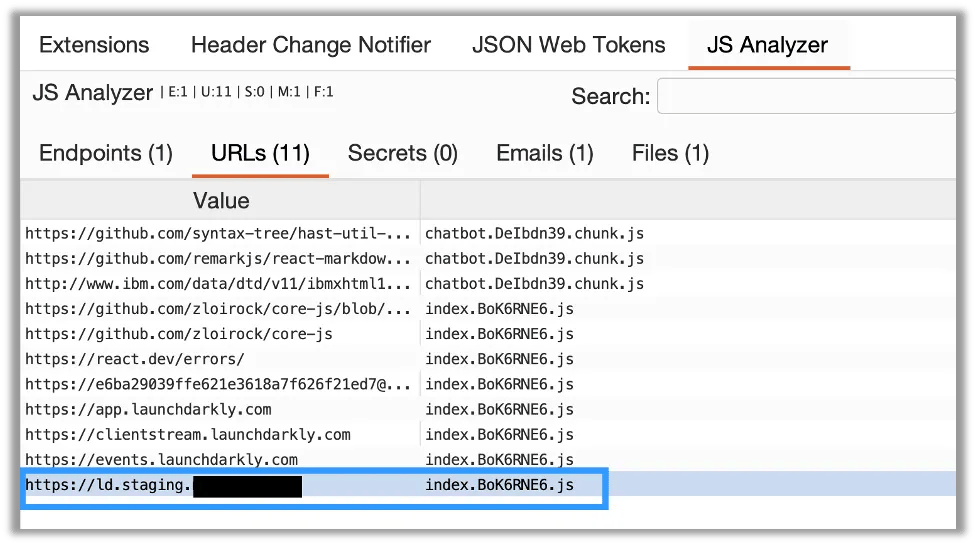
JS Analyzer is another passive extension that hooks into Burp’s proxy and scans JavaScript files for endpoints, parameters, and secrets as you browse. It runs quietly in the background and surfaces findings directly in the Burp issues panel, which makes it easy to review what it pulled without breaking your testing flow. It pairs well with GAP and JS Miner because the three tools have slightly different parsing logic, so running them together catches endpoints that any one of them would miss on its own.
A Few More Approaches Worth Mentioning
The three methods above cover a few common methods, but they are not the whole picture. Other techniques worth exploring on your own include parsing mobile app traffic through a proxy with cert pinning bypassed, scraping Swagger or OpenAPI definitions from common paths like `/swagger.json`, `/v2/api-docs`, or `/openapi.yaml`, querying GraphQL introspection if it is left enabled, checking `robots.txt` and sitemap files, looking for exposed `.git` directories, and reviewing source code repositories if the app is open source or has had leaks. Source maps are also a great source and can be passed through a tool like sourcemapper for clean grep-able JavaScript.
Wayback Machine and similar archives can also surface old endpoints that still work but are no longer linked from the live site. Those legacy paths are gold for Broken Authorization testing because they often predate the authorization controls applied to newer routes.
Putting It Together
Good OWASP web app and API pentesting starts with thorough enumeration. Ensure you have a comprehensive plan for static and dynamic analysis. That means looking for otherwise hidden endpoints by trying to pull JavaScript bundles using DevTools breakpoints to bypass auth-wall redirects or through source map files.
For Blazor and other compiled-frontend apps, decompile the assemblies and grep through the output. Run a couple of Burp extensions in the background so every endpoint your browser touches gets logged for later. Combine all three sources, deduplicate, and you will have an endpoint inventory that gives you real coverage when you start testing for object-level authorization flaws.
If you found this blog helpful, take a look at our other blogs on web application and API penetration testing.